CytoViva’s Hyperspectral Microscopy technology was specifically developed for spectral characterization and spectral mapping of nanoscale samples imaged with the patented CytoViva darkfield-based microscope. In addition, this hyperspectral imaging technology supports a wide range of other types of samples, from micro to macro in scale.
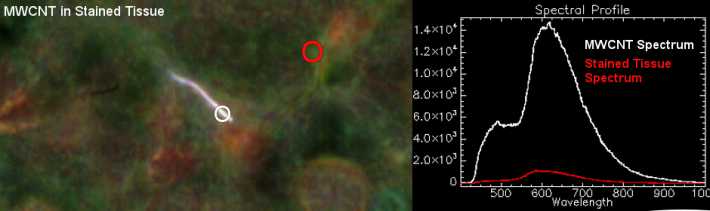
Hyperspectral microscope images appear very similar to a traditional optical microscope image with one important difference. Each pixel of a hyperspectral image provides the complete reflectance spectral response of that pixel’s spatial area within the VNIR or SWIR spectral range. This enables nondestructive spectral measurements of nanoscale elements in the full spatial context of the sample image.
At 100x magnification, a hyperspectral microscope image may contain as many as 700,000 pixels, each as small as 128nm each. This hyperspectral data is recorded at approximately 2nm of spectral resolution in the VNIR range, enabling minute spectral differences to be measured from pixel to pixel within the image.
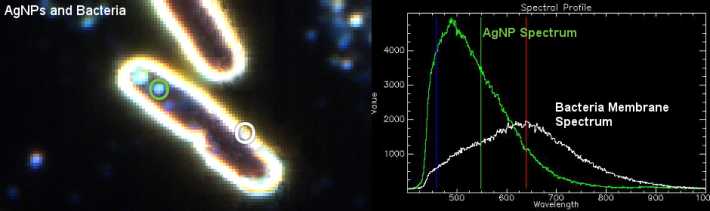
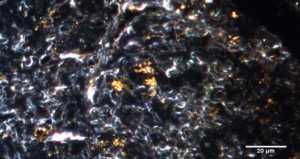
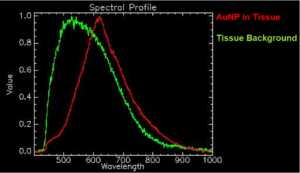
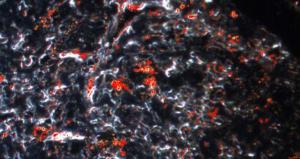
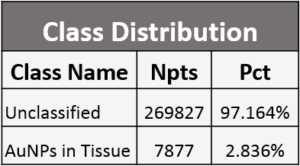
Hyperspectral microscope images can be captured of both biological and materials-based nanoscale samples. These nanoscale materials may be integrated in a wide range of biological or materials based environments. See in the images an example of AuNPs in ex-vivo lymph node tissue. In this example, hyperspectral imaging makes it possible to quickly identify and map the AuNPs present in the tissue and provides a class distribution confirming the total area where AuNPs are present.
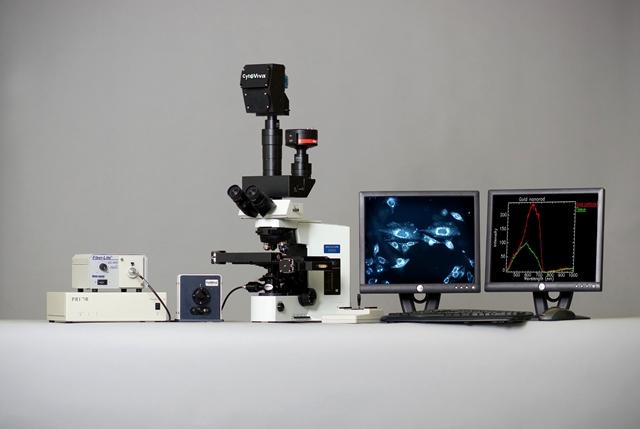
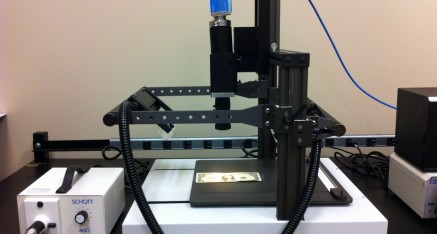
These hyperspectral images are created in a line scan or “pushbroom” fashion, by moving the sample across the field of view of the microscope and spectrograph via an automated translational microscope stage. Typically these hyperspectral images are created in seconds or minutes, depending on the required exposure. Components for the microscopy based hyperspectral imaging system include a specialized light source, automated translational stage, transmission diffraction grating spectrograph and camera. These components are integrated to work together with highly functional image capture and analysis software. This proprietary software provides the ability to compare spectra within a sample image or among large numbers of samples. It can also build a spectral library of unique samples elements and using this spectral library, these sample elements can then be mapped in subsequent samples.
CytoViva hyperspectral imaging can be acquired in either the visible near-infrared (VNIR 400 nm – 1,000 nm) wavelength ranges as well as in the short wave infrared (SWIR 900 nm – 1,700 nm) wavelength ranges.
See below a system configuration for hyperspectral imaging of macro-scale samples that do not require microscopy level imaging.
Videos
Files
| Attachment | Size |
|---|---|
| 582.29 KB | |
| 299.01 KB | |
| 595.65 KB | |
| 299.9 KB | |
| 304.41 KB | |
| 432.34 KB |
News, events, promotions, webinars
- Easy Visualization of (nano)particles without fluorescence markers
- Spectral range: 400nm - 1.000nm
- Spectral libraries of pure nanoparticles enable unambiguous localization and identification in complex environments
- Enivornmental chamber for long-term studies of live-cells
- simultaneouos real-time imaging of fluorescent and non-fluorescent sample structures
- Applications: mapping of nano-particles in tissue, drug delivery, nano-toxicity, pathogen detection, ect.

Coverage of the sample area is achieved by translating the sample slide in small increments along one direction with the motorized stage. This motion brings adjacent areas of the sample to the cross-hair position where a spectral image is recorded. Each recording covers a narrow line which is parallel to the horizontal cross-hair, and contains the spectrum of every point along the line. By repeating this motion, the spectra from a two-dimensional area of the sample are acquired. This process is known as “pushbroom hyperspectral scanning”, and allows both the sample image and the spectrum from every point in the image to be captured as a hyperspectral data cube. The dimensions of the cube include the X and Y dimensions of the spatial area and the spectral data associated with each pixel of the image.

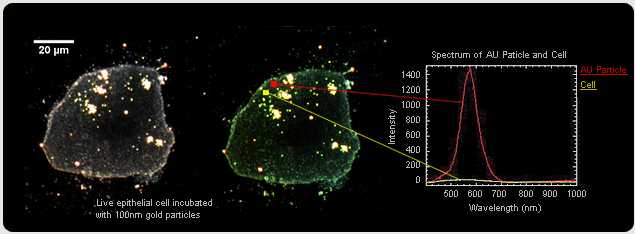
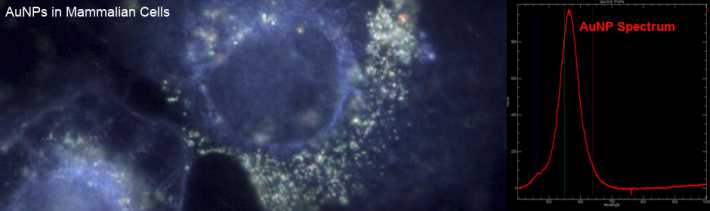
Seen here (at left), in a view from the eyepiece, the microscope is focused on a group of cells that have been incubated with nanoparticles. Some of the particles are out of focus (large circles) and others appear focused inside the cell. The hyperspectral datacube is scanned from the area inside the red box. Motion of the slide causes the scan lines to move from the top to the bottom of the box. The blue and green scan lines shown here (marked 1 and 2 along the Y direction) intersect two nanoparticles which were inside the cell.
At each line the system takes a digital picture that contains the spectra of all points in the X direction. Here (at right) are spectral pictures taken at the blue and green lines. Spectra of the bright nanoparticle and fainter cell structure are visible. These two pictures belong to the full set of up to several hundred lines that will form the hyperspectral data cube.

Once the scan is completed, the CytoViva-ENVI software opens the datacube (seen at left). The datacube is an RGB (red, green, blue) recreation based on the spectral intensity measured at each pixel. At right, we are viewing plots of the spectra from the two nanoparticles, having clicked on pixels that overlapped their locations. Spectra of all points in the image are likewise found. These spectra can be exported for further analysis or saved as spectral libraries.