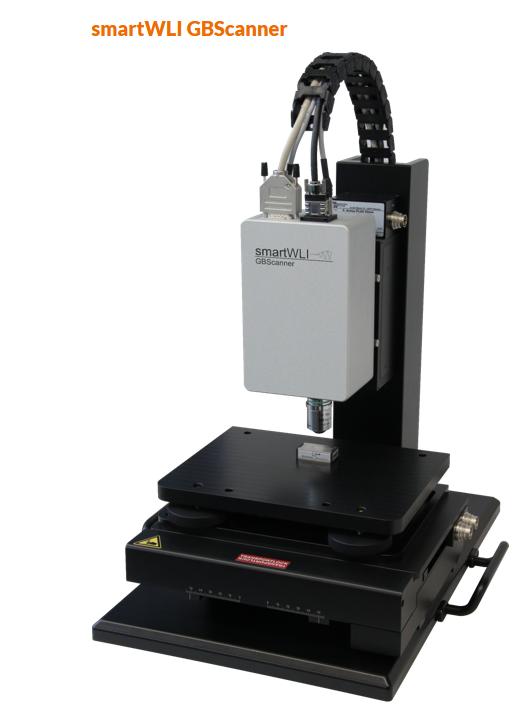
The smartWLI GBScanner is an advanced optical profilometer designed for fast and reliable surface roughness measurements. Using white light interferometry (coherence scanning interferometry), it offers sub-nanometer topographic reproducibility, enabling precise measurements of microgeometries and roughness.
GBS ILMENAU
Key Features:
-
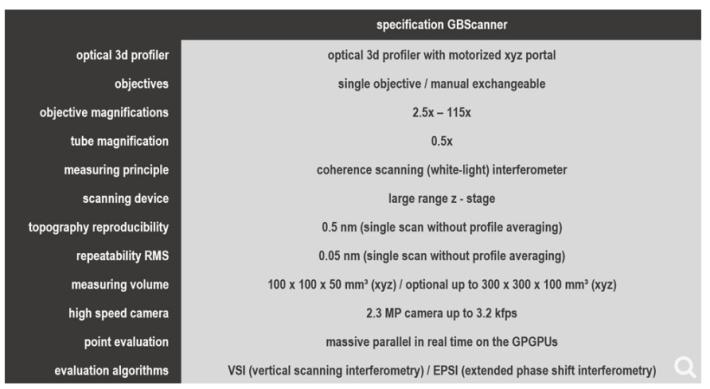
3-Axis Scanning System: Equipped with a motorized tripod for scanning and positioning, the GBScanner has a standard measurement volume of 100 x 100 x 50 mm³ (xyz), expandable up to 300 x 300 x 100 mm³ for medium-sized samples.
GBS ILMENAU -
Interchangeable Interferometric Objectives: The system can be configured with objectives ranging from 2.5x to 115x magnification, allowing resolution of structures with lateral dimensions starting from approximately 0.3 µm.
GBS ILMENAU -
Advanced Data Processing: By utilizing high-speed cameras and massive parallel data processing, the GBScanner accelerates acquisition and processing times, making the system robust and less sensitive to vibrations. This enables the acquisition and stitching of hundreds of individual scans with typical cycle times of 1-3 seconds per scan.
GBS ILMENAU -
Integrated Analysis Software: The acquired 3D data is evaluated using MountainsMap® software, allowing automated scans and data evaluations through custom macros.
GBS ILMENAU
Advantages Over Other 3D Optical Measurement Technologies:
The white light interferometry used in the GBScanner offers superior resolution compared to other 3D optical measurement principles, such as confocal microscopy, focus variation, chromatic confocal sensors, fringe projection, or laser triangulation sensors. This makes it ideal for applications requiring high precision in surface characterization.
GBS ILMENAU
In summary, the smartWLI GBScanner is an advanced solution for 3D optical profilometry, combining speed, precision, and flexibility to meet measurement needs across various industrial and research sectors.
News, events, promotions, webinars
- 3D inspection of cylinder surface and cylindrical honing structures
- Comprehensive geometric analysis (lengths, angles, heights & depths, volume, etc.)
- 2D roughness and waviness analysis of components (accord. ISO 16610, 13565, 12085)
- 3D parameters according to ISO 25178 (roughness, functional characteristics: bearing ratio and volume)
- Optimized for use in the development, manufacturing and quality assurance
- Optional software upgrade can add pore analysis
There are many competitive technologies used, new on the market or under development. All technologies have several production steps and adapted quality control.
Aluminum engine blocks
- Monolithic
- Hypereutectic Al-Si Alloy
- Quasi-monolithic Coated Bores
- Galvanic Ni-Sic dispersion
- Plasma coating
- PVD thin layer, TiN, TiAlN
- Quasi monolithic local material engineering
- Al matrix compound
- Laser Alloying with Si
- Heterogenous-liner Dry cast-in
- Grey iron machined
- AlSi/PM
- Grey iron as cast with rough outer surface
- Grey iron coated
- Plasma sprayed
- Heterogenous-liner Dry pressed-in
- Grey iron
- Hypereutectic Al-Si
- AlSi/PM
- Heterogenous-liner wet slip-in
- Galvanic Ni-Sic dispersion
Structure Evaluation
Honing structures
- Honing angle
- Honing grooves
- directional classification (rising, falling, across..)
- numbers, depth, area, volume
- Distance between groove
- Cross grooves
Plateaus
- Contact roughness
Cavities / Pores
- numbers / distances
- volume
- area
- depth
- distribution of cavities (according volume, area and depth)
Marbling
- % over surrounding surfaces
Surface roughness
Functional 2D parameters
- Rk, Rpk, Rvk
Functional 3D parameters
- Sk, Spk, Svk

Technologies get optimized in the same directions:
- lower friction
- wear resistance
- lower oil consumption
- weight reduction
...but measuring devices are used for different purposes
R&D:
- detailed analysis for technology optimization
Quality control:
- fast survey of predetermined parameters
- different priorities for the used technology


More structures per scan - More details from each structure

FOV: 7,2 X 4,5 mm2
time: <10s
z-res: 1 nm
xy-res: 3,5 um
Comment:
Larger honing structures are still visible but the point density of 3,5 um isn't enough to evaluate small structures starting from app. 10 um. Using of an higher point density is recommended

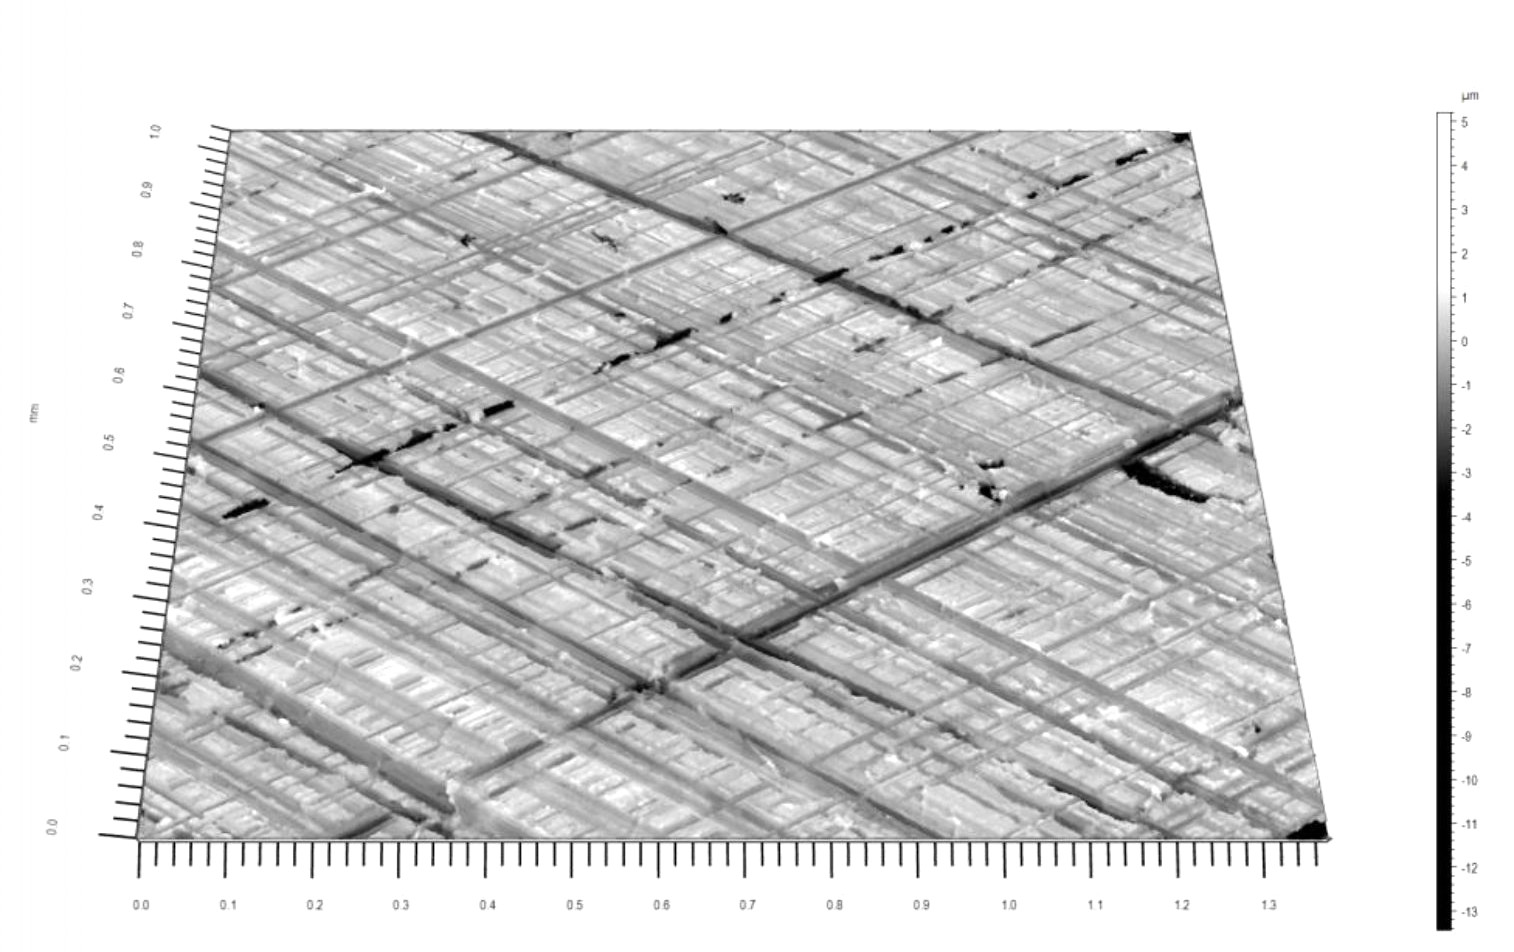
FOV: 0,28 x 0.21 mm2
time: <10s
z-res: 1 nm
xy-res: 0,2 um
Comment:
All details are very good visible, but the significance from single structures for the rating of complete cylinder liners is very limited. Larger areas are recommended.

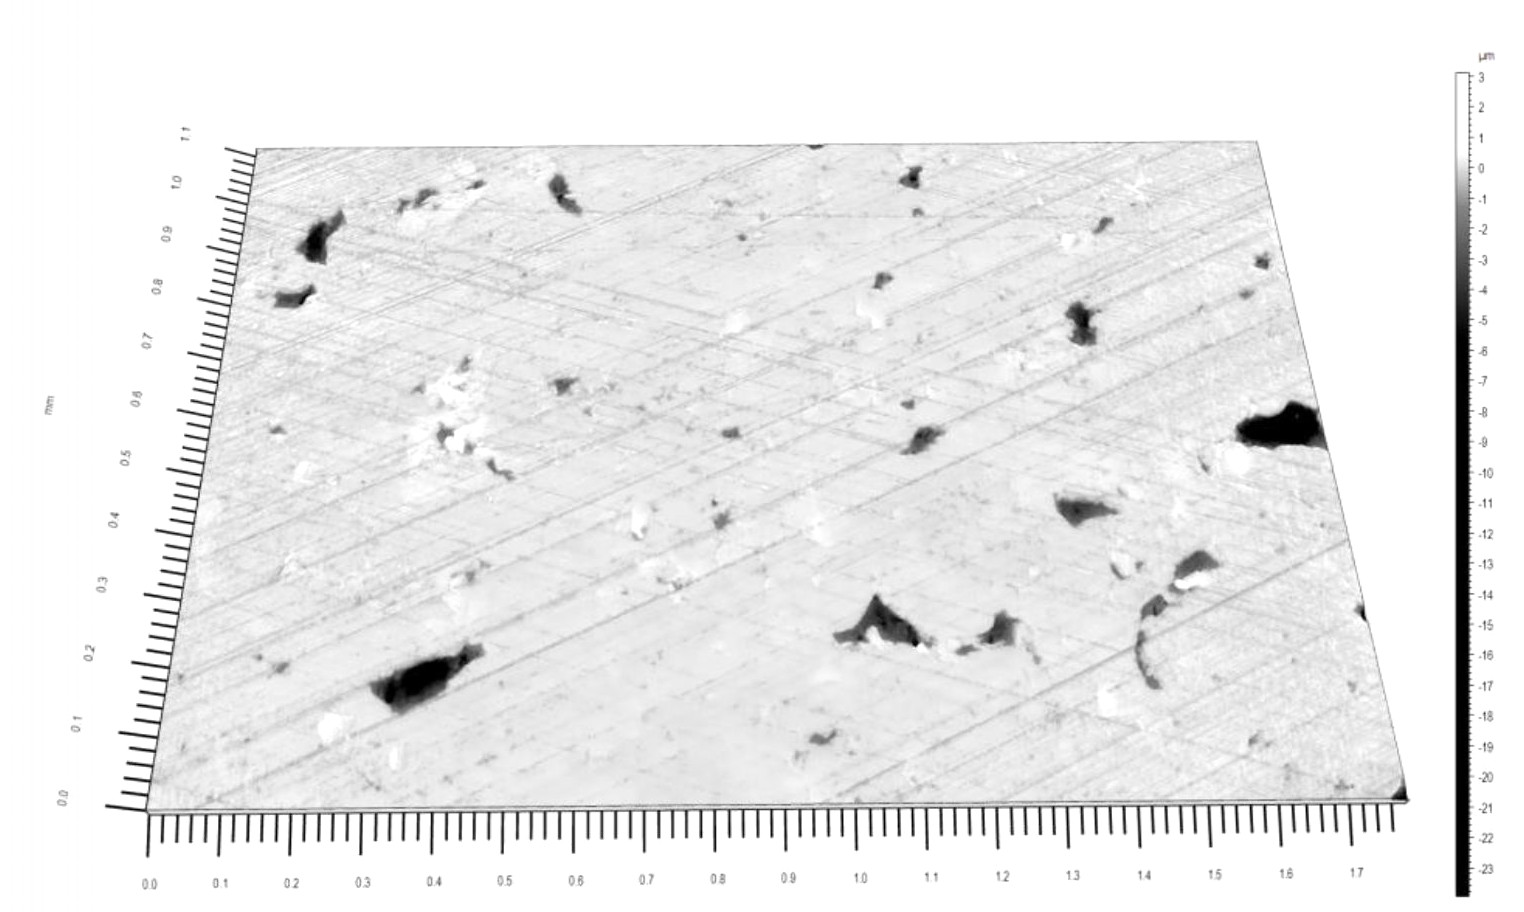
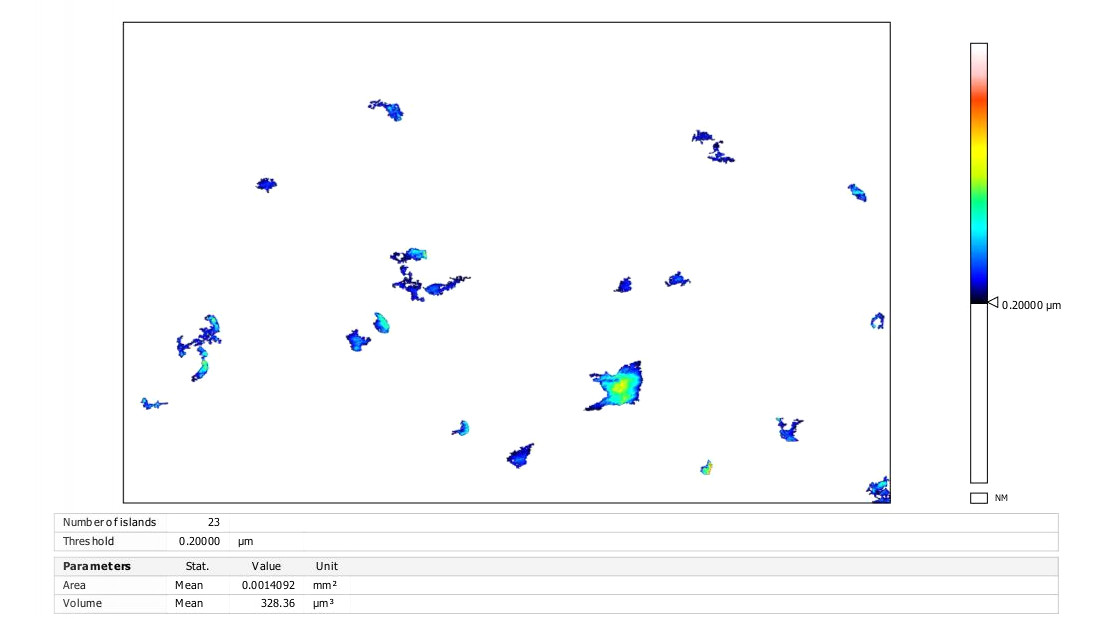
FOV: 7,2 x 4,5 mm2
time: <10s
z-res: 1 nm
xy-res: 3,5 um
Comment:
the cavities show a local variation of areas with higher and lower densities. It is recommended to use multiple evaluation fields. In addition to the average it is recommended to check the local variation of the cavities in different positions.
Check the table here below to select the correct system configuration:
- min. 10x higher resoluzion in xyz than the feature which sould be measured
- min. 10 evaluation features inside the scanning area
- min. 10 measuring positions for statistical analysis
Features | Parameters | Reality* Seize | Reality* Depth | Reality* Density | RSP** - xy res. | RSP** - z res. | RSP** - area |
|---|---|---|---|---|---|---|---|
cavities | area | 500 um2 | > 1 um | 10 / mm2 | < 2 um | < 100 nm | > 1 mm2 |
honing | depth | 10 um | 0,1 um | >1 / mm | < 1 um | < 10 nm | > 1 mm2 |
marbling | area % | 0,01 mm2 | 0,1 um | 10 / mm2 | < 1 um | < 10 nm | > 1 mm2 |
plateaus - peaks | Spk / Rpk | 0,01 mm2 | 20 nm | 100 / mm2 | < 1 um | < 2 nm | > 0,1 mm2 |

")

")
Robust filters (polynomial, gaussian, and combinations) are the basis for all the following evaluation processes. "Robust" are filters which eliminate the influence of cavities and avoid local waves on the filtered surface.


Structure characteristics (directional orientation, depth, height, size) can be used to separate the structures from each other and evaluate them separately.

Comment:
The GBS programmed Honing Structure FFT Analysis allowed a separate analysis of rising and falling structures. The sample on the right shows a higher percentage of closed structures because of the cavities (positive) but also more cross structures. The scan on the left side shows more falling structures and on the right side more rising structures.


Separated cavities could be counted and statistically evaluated.
Many classificatory operators - as depth, volume, form factors, etc.. - can be used to analyze many partial aspects from the cavities.


Marbling - The camera image shows a texture as could be seen on marble surfaces. the black lines are cracks in the surface. Inner tensions could cause that surface plateaus standing out of the surrounding areas.
Areas which are standing up can be detected and evaluated.
Technical Features
Cylinder Diameter | 70 - 125 mm (standard configuration) |
Measurement Technique | White-Light Interferometry |
Height resolution / nm | 1nm (all objectives / field of view) |
Scanner | Precision piezo drive with gauge control |
Scan Range | 200 um |
Speed | up to 20 um/s |
System Software | smartVIS 3D / Speedytec on GPU |
Evaluation software | Mountains Map with GBS programmed extensions |
Array | 1624 x 1324 measuring points |
Weight | 12-14 Kg |
Power Supply | 100 to 240 VAC, 50/60 Hz |
Standard | Manual down to app. 188 mm |
Extended | Manual down to app. 270 mm |
Motorized | Automated z axis down to app. 200 mm |
Magnification | 5x | 10x | 20x | 50x |
Field of view / mm | 2.8 x 2.08 | 1.4 x 1.04 | 0.7 x 0.52 | 0.28 x 0.21 |
Point Distance / um | 1.6 | 0.8 | 0.4 | 0.16 |