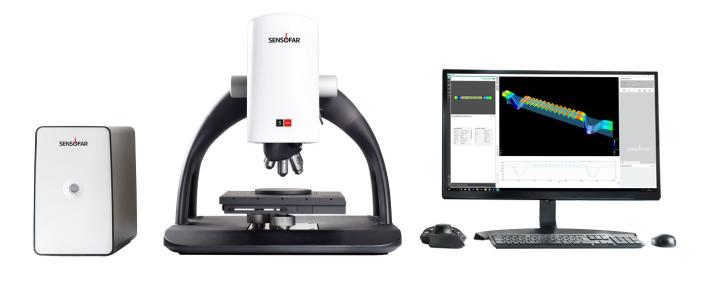
The new S neox outperforms existing optical 3D profiling microscopes in terms of performance, functionality, efficiency and design, providing Sensofar with a class-leading areal measurement system.
Files
| Attachment | Size |
|---|---|
| 12.57 MB | |
| 1.84 MB | |
| 2.6 MB | |
| 3.84 MB |
News, events, promotions, webinars


Faster than ever
Everything is faster than before with new smart and unique algorithms and a new camera. Data acquisition is taken at 180 fps. Standard measurement acquisition is 5X faster than before. Making the S neox the fastest areal measurement system in the market.
Easy-to-use
Sensofar is continuously working to provide the most incredible experience to our customers. With the fifth generation of the S neox systems, the goal has been to make it easy to use, intuitive and faster. Even if you are beginner user, the system can be managed with just one click. Software modules have been created to adapt the system to the user requirements.
Quality Control
Automated modules have been created to facilitate all QC procedures. Ranging from operator access rights control, recipes, compatibility to barcode/QR readers, and customized plugins from our proprietary SensoPRO software to generate pass/fail reports. Our optimized solutions are able to work in QC environments due to their flexibility and easy-to-use interface, which can be programmed to work 24/7.
Research & Development
With Sensofar’s 3-in-1 approach –a single click in SensoSCAN switches the system to the best technique for the task at hand. The three measurement techniques found in the S neox sensor head –Confocal, nterferometry, Ai Focus Variation– each contribute critically to the versatility of the system and help to minimize undesirable compromises in the data acquisition. The S neox is ideal for all lab environments, without limitations.


Ai Focus VariationNEW!
Active illumination Focus Variation vertically scans either optics (with very low depth-of-field) or the sample to obtain a continuous set of images of the surface. An algorithm determines which points in each frame are in focus, and an entire image is built up using all in-focus points from all frames. It has been improved with the use of active illumination to get more reliable focus location even on optically smooth surface.
Confocal
Confocal scanning is a microscopy imaging technique that utilizes an aperture at the confocal plane of the objective. Out-of-focus light is thus prevented from entering the imaging system and only the in-focus plane on the sample is captured. 2D profiles and 3D surface images can be captured by scanning the aperture mechanically or digitally.
Interferometry
Optical Interferometry makes use of the optical path difference between light reflected in the two arms of the interferometer (reference and sample) to yield an spatial interference pattern (interferograms) that contains information on the surface topology of the sample. Various variations of the approach can be used for particular applications.
Thin film
Thin film measurement technique measures the thickness of optically transparent layers quickly, accurately, non-destructively and requires no sample preparation. The profilometer acquires the reflectance spectrum of the sample in the visible range, and is compared with a simulated spectra calculated by the software, with layer thickness modification until the best fit is found. Transparent films from 50 nm to 1.5 μm can be measured in less than one second. Sample evaluation spot diameter is dependent on the objective magnification which can be as low as 0.5 μm and up to 40 μm.

The advantages of using a LED over a laser are vast. LEDs avoid interference patterns and scattering typical of laser light sources. LEDs illuminate an area, rather than a single spot, yielding faster measurement. The estimated lifetime of an LED is about 50.000 h (25 times better than a laser). Finally, they offer great versatility, allowing different wavelengths to be used depending on sample requirements.


Every S neox is manufactured to deliver accurate and traceable measurements. Systems are calibrated using traceable standards following the ISO 25178 standard part 700 and part 600 for: Z amplification factor, XY lateral dimensions, flatness deviation, system noise as well as parcentricity and parfocality. Any metrology instrument must fulfill it before providing any result.
Every S neox is calibrated to estimate the metrological characteristics using a traceable calibration standard, adjusted to correct systematic errors and verified to match the calibrated value. Finally, the performance specifications are checked, and the instrument characteristics, such as accuracy, and repeatability are provided with the system.
Vertical resolution is limited by the instrument noise, which is fixed for Interferometry, but dependent of the numerical aperture for Confocal. Sensofar proprietary algorithms deliver nanometer level system noise for any measurements technique at the highest possible lateral resolution for an optical instrument.
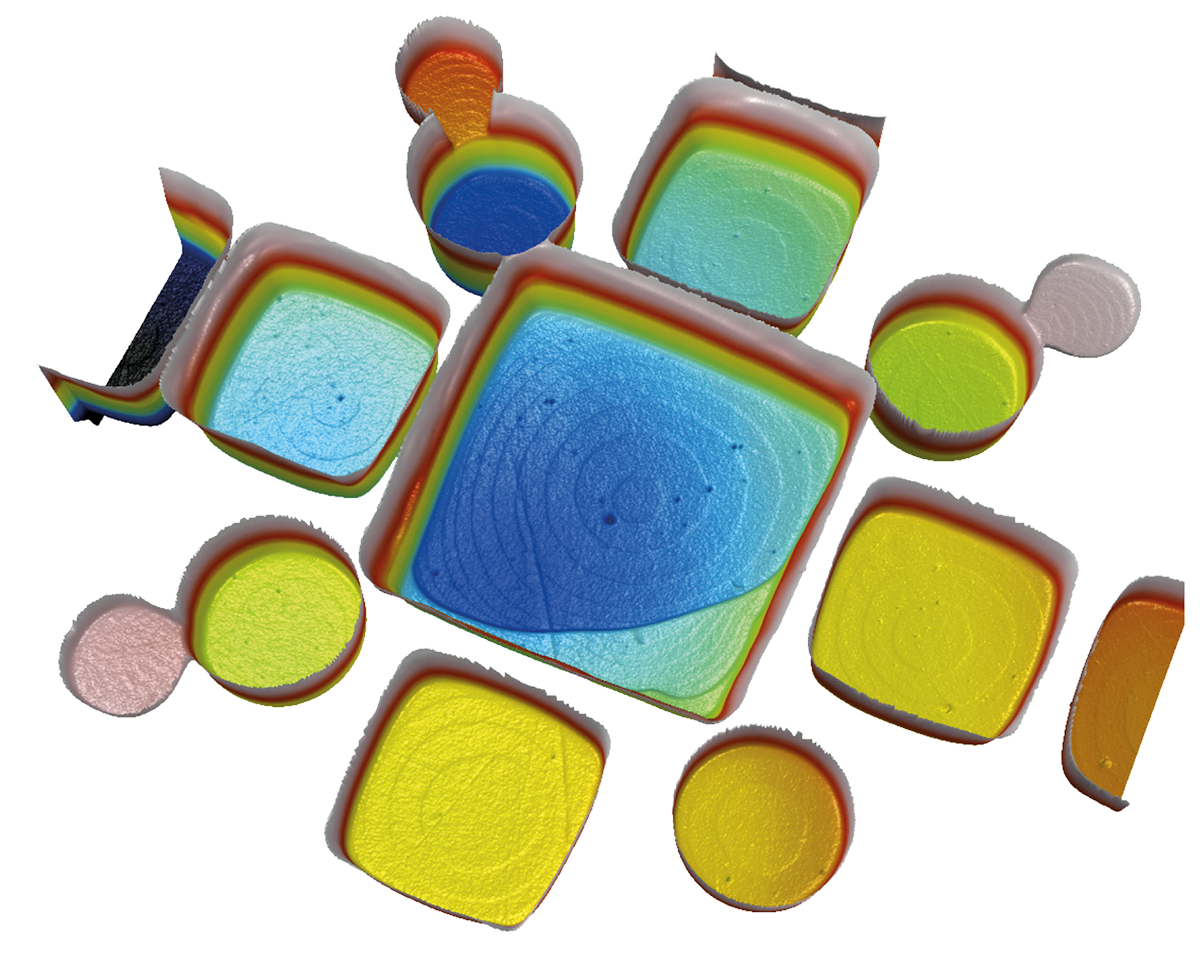
The topography shown is a subnanometer (0.3 nm) atomic layer. Courtesy of PTB.

Differential Interference Contrast (DIC) is used to emphasize very small height features that has no contrast in normal observation. With the use of a Nomarski prism, an interferential image is created resolving sub-nanometer scale structures not visible in brightfield or confocal images.

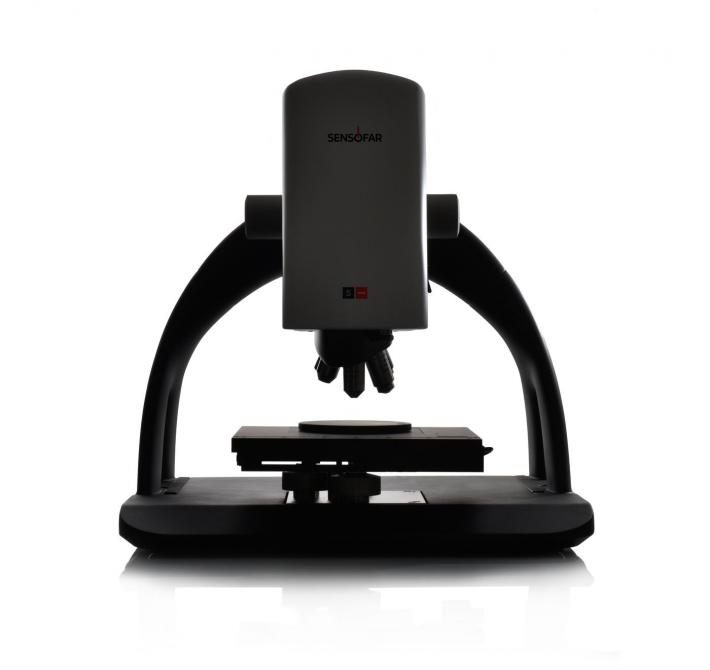
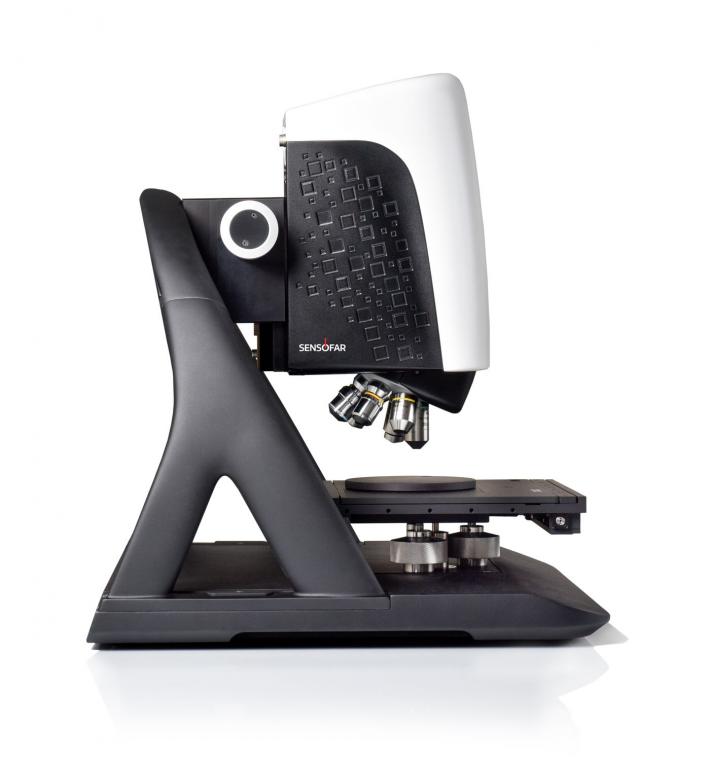
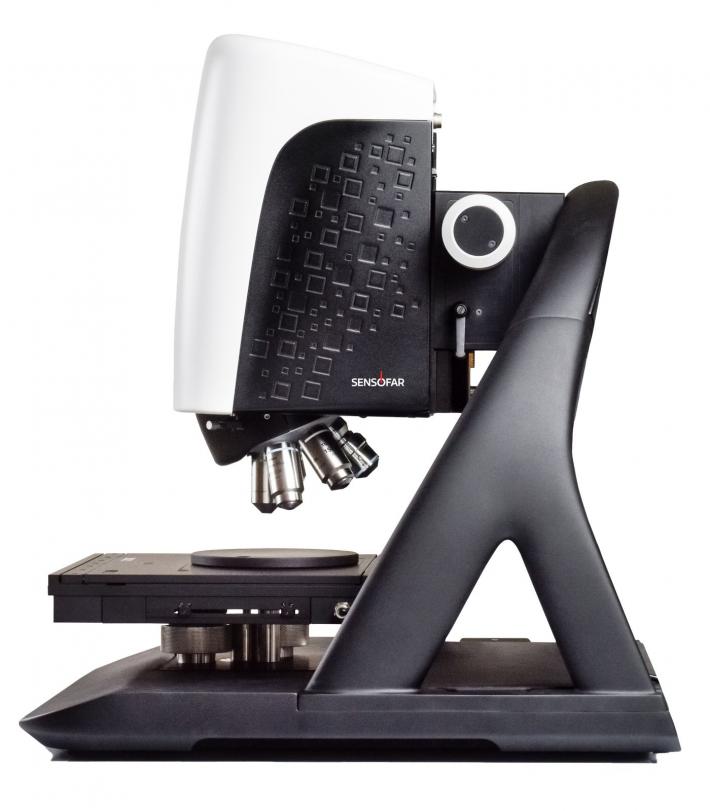
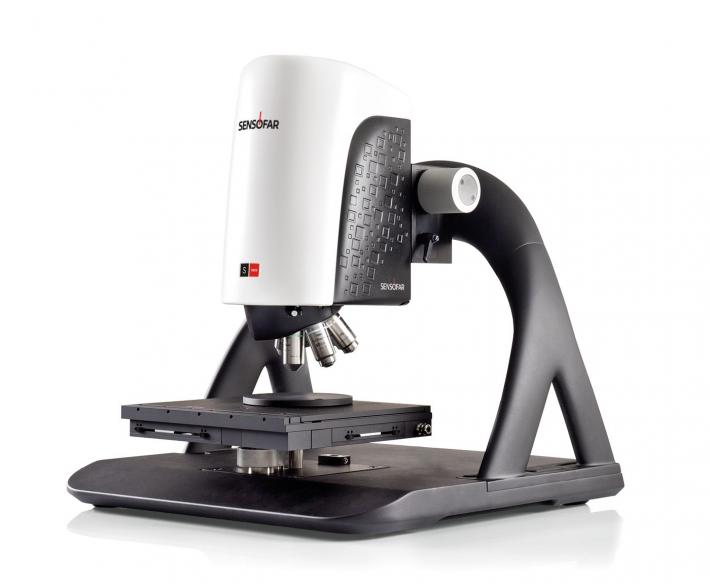
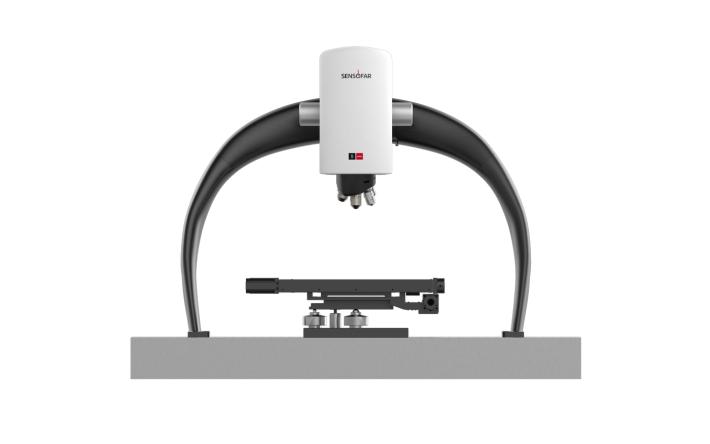
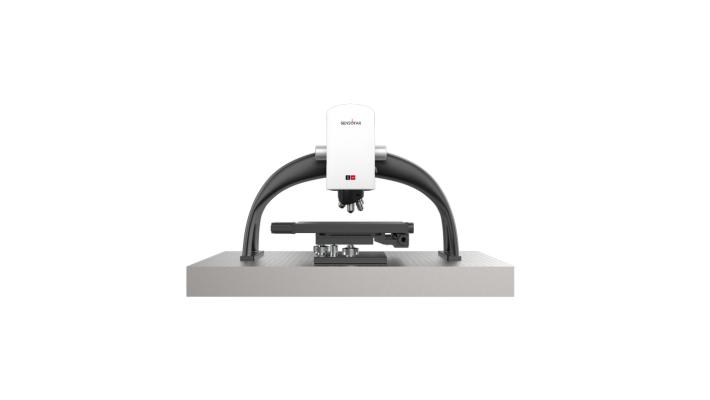
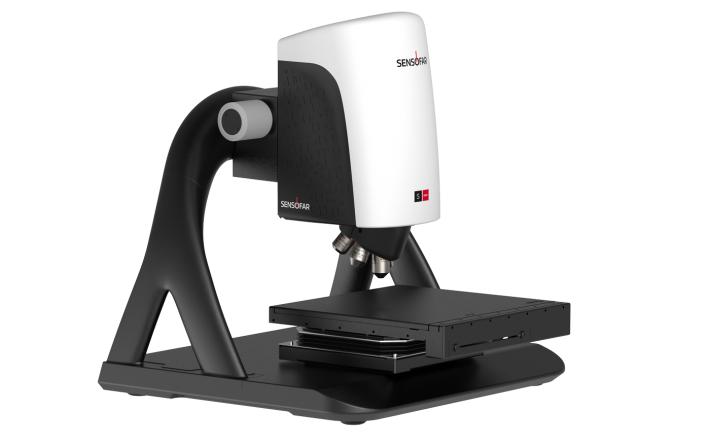
S neox design is ideal for obtaining a fast, noninvasive assessment of the micro- and nanogeometry of technical surfaces in multiple configurations. S neox provides the flexibility, durability and efficiency required from the standard setup for R&D and quality inspection laboratories to sophisticated, customized solutions for online process controls, measuring samples up to 300×300 mm2 and maximum height up to 350 mm. The S neox 3D optical profiler is a complete tool.
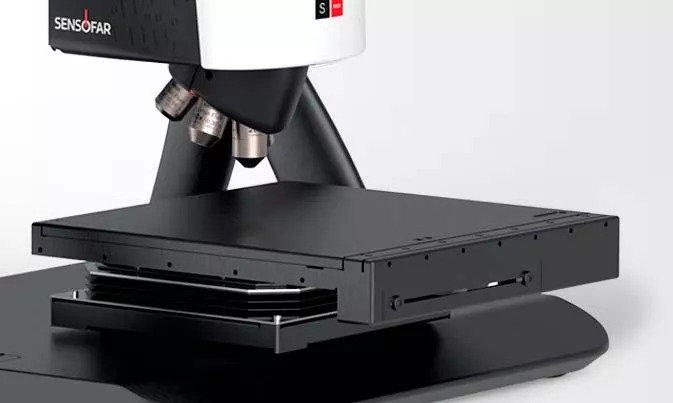
The motorized tip-tilt has been designed to automatically level the sample in less than 3s. This device reduces sample preparation time, and allows sample leveling in multiple positions for automated applications. The auto-tilt function can be used with all imaging techniques.

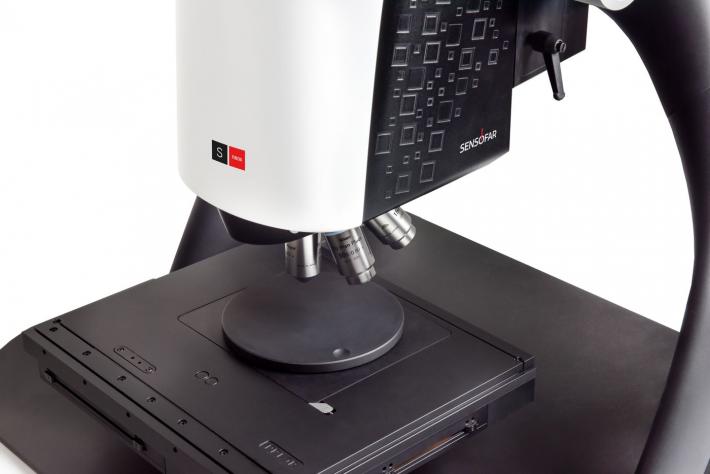
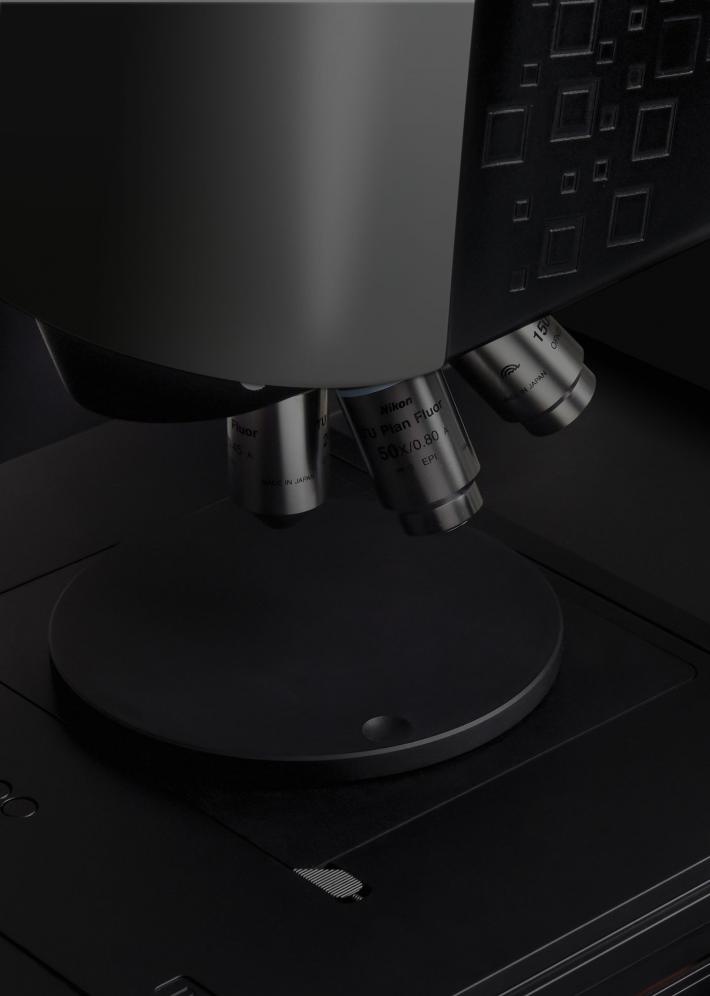
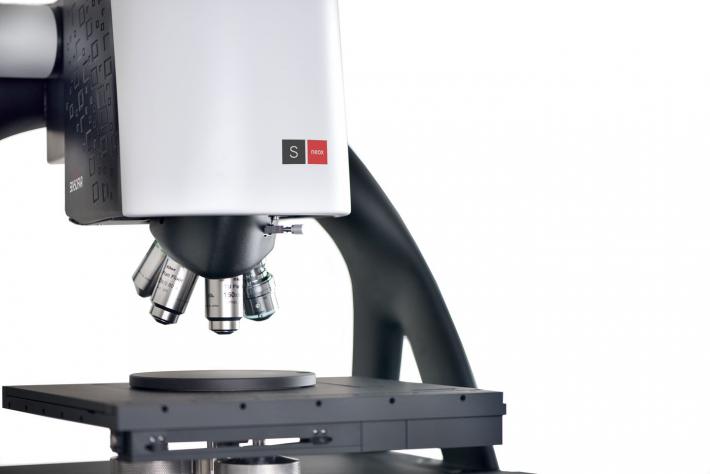
The motorized nosepiece can hold up to six objectives simultaneously, including brightfield and interferometry objectives. The SensoSCAN software handles the motorized change automatically and corrects automatically any possible parfocality adjustment.


The Five Axis rotational stage consists of a high-precision motorized rotating A axis with 360º of endless rotation, 10 arc sec positioning repeatability, a motorized B axis, -30º to 110º, 0.5 arc sec resolution, with limit switch. It is equipped with a System3R clamping system and everything is fully integrated into the S neox design.
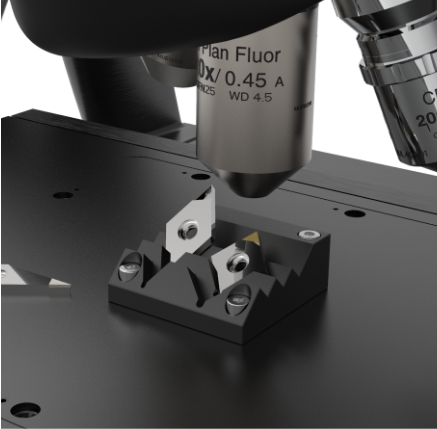
The insert holder is an optional accessory designed to position cutting tools in the precise location needed for measurement. It is compatible with all insert models currently on the market.
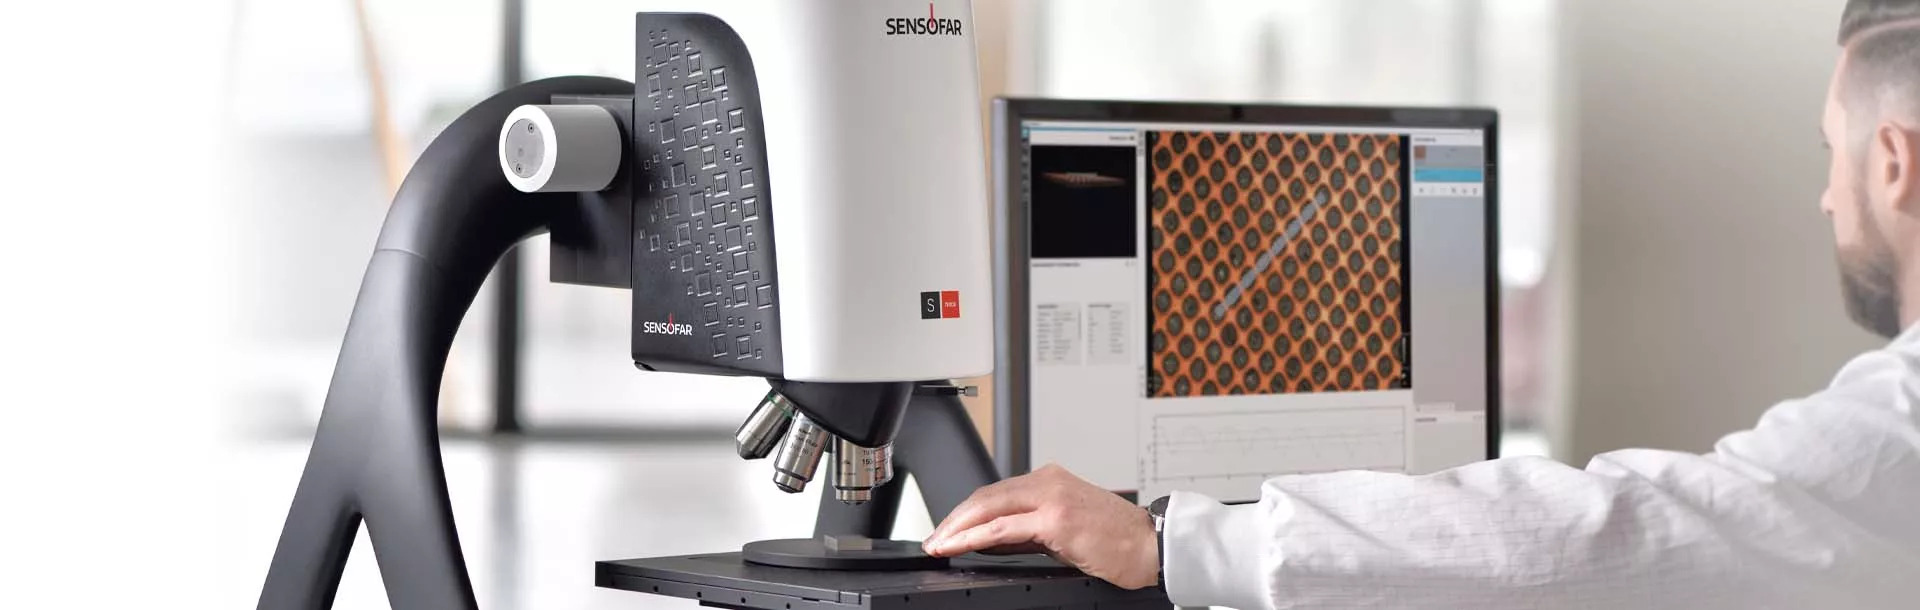


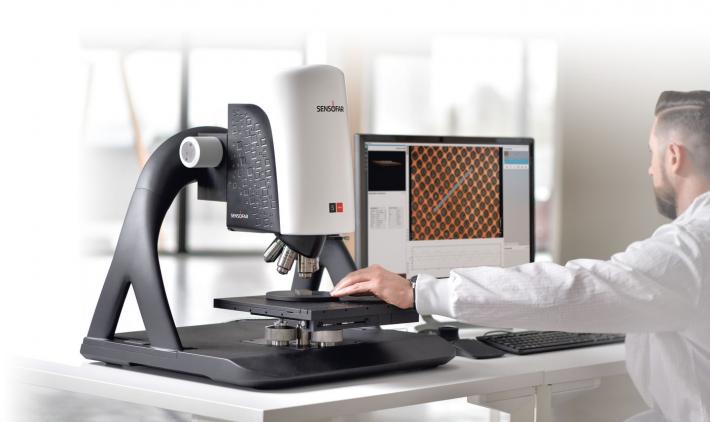
SensoSCAN Software drives the systems with its clear and intuitive user-friendly interface. The user is guided through the 3D environment, delivering a unique user experience.
Sample Navigation
An overview tool helps the user to inspect the sample during measurement preparation, check measurement positions before acquisition as well as assist in the automation procedure. Working with high magnification will be easier, as you will know where you are at every moment.
Auto 3D Function
Selecting 3D Auto function, the SensoSCAN software automatically determines the correct illumination and the appropriate measurement range, and then performs the chosen measurement type. A high-quality result can thus be obtained within just a few seconds.
Analysis & Reporting
It is also possible to create analysis templates to apply pre-determined filter and operator configurations to repeated measurements. And finally, obtain a clear and well-structured report for each measurement, showing the 3D data, a 2D profile and all the ISO parameters.
Automated procedures module
The automated procedures module is an easily customizable tool for creating quality control procedures. Creating and running multiple measurement recipes is accomplished using our recipe tool that commands the system to perform several measurements at pre-defined positions. The module combined with tools such as the user manager, sample identification, data exportation, and 'pass or fail' tolerance comparison provides all what is need for QC inspection.
Extended measurements module
SensoSCAN’s extended measurements module allows the user to easily define the measurement layout on the surface by means of the overview image. The area can be automatically cropped to rectangular, circular or ring areas of interest. Wide areas up to 500 million pixels are possible. Several scanning strategies such us autofocusing on each field, or focus tracking to minimize vertical scanning range are available.

The S neox introduces a new functionality that allows to replicate a defined multiple measurement recipe to an array of samples. The multiple measurements will thus be repeated at each sample relative to each sample's reference point. This simplifies the programming of these recipes, as the recipe is defined only once, and improves the reliability. This will solve long-standing requirements from customers working in QC 24/7.

The S neox now includes automatic detection of fiducials, based on pattern matching algorithms, that enables fully-automated operation without human interaction. What used to be difficult and imprecise, now becomes easy, repetitive, and accurate. The combination of this reference recognition and our automated routines is a step-forward towards industry 4.0.

SensoVIEW is an ideal software for a broad range of analysis tasks. It includes a comprehensive suite of tools for preliminary examination and analysis of 3D or 2D measurements, allowing roughness or volume calculations and measuring critical dimensions (angles, distances, diameters) with a set of analysis tools.
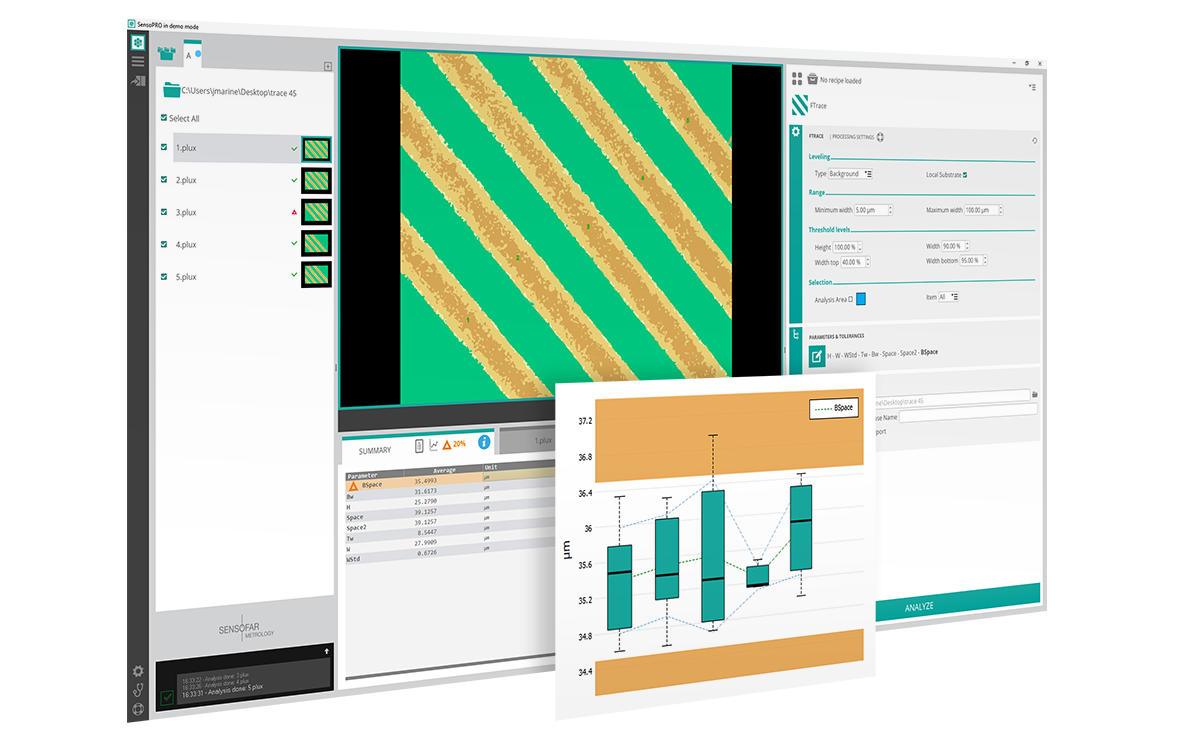
SensoPRO - Advanced software package optionally available.
It has never been so easy to perform rapid quality control in a production line. Thanks to SensoPRO, a production line operator only needs to load the sample and follow guided instructions to get a pass/fail report. Plug-in-based data analysis algorithms provide a high degree of flexibility. New modules can be easily customized to other industry needs.

SensoMAP, based on Mountains technology from Digital Surf, is an extremely powerful tool for analysis and reporting. SensoMAP software is completely modularly adaptable to customer requirements. Two levels (standard and premium) and several modules are available.
Technical Features
Red | Green | Blue | White |
|---|---|---|---|
630nm | 530nm | 460nm | 575nm |


1 Maximum field of view with 3/2” camera and 0.5X optics. 2 Pixel size on the surface. 3 L&S: Line and Space. Values for blue LED. 4 System noise measured as the difference between two consecutive measures on a calibration mirror placed perpendicular to the optical axis. 5 On smooth surfaces, up to 71º. On scattering surfaces, up to 86º.


1 Maximum field of view with 3/2” camera and 0.5X optics. 2 Pixel size on the surface. 3 L&S: Line and Space. Values for blue LED. 4 System noise measured as the difference between two consecutive measures on a calibration mirror placed perpendicular to the optical axis. For PSI, 10 phase averages with vibration isolation activated. The 0.01 nm are achieved with Piezo stage scanner and temperature controlled room. Values for green LED (white LED for CSI). Resolution HD. 5 On smooth surfaces, up to 71º. On scattering surfaces, up to 86º.


Objective lense used for Confocal and Ai Focus Variation 50X 0.80 NA and for CSI and PSI 50X 0.55NA.
Resolution 1220×1024 pixels. All measurements are done using PZT.
Uncertainty (U) according to ISO/IEC guide 98-3:2008€ GUM:1995, K=1,96 (level of confidence 95%). σ according to 25 measures.
7 Area of 1x1mm. 8 Profile of 4mm lenght.
